Part 02 — The Players
The Three Companies: A Financial Profile
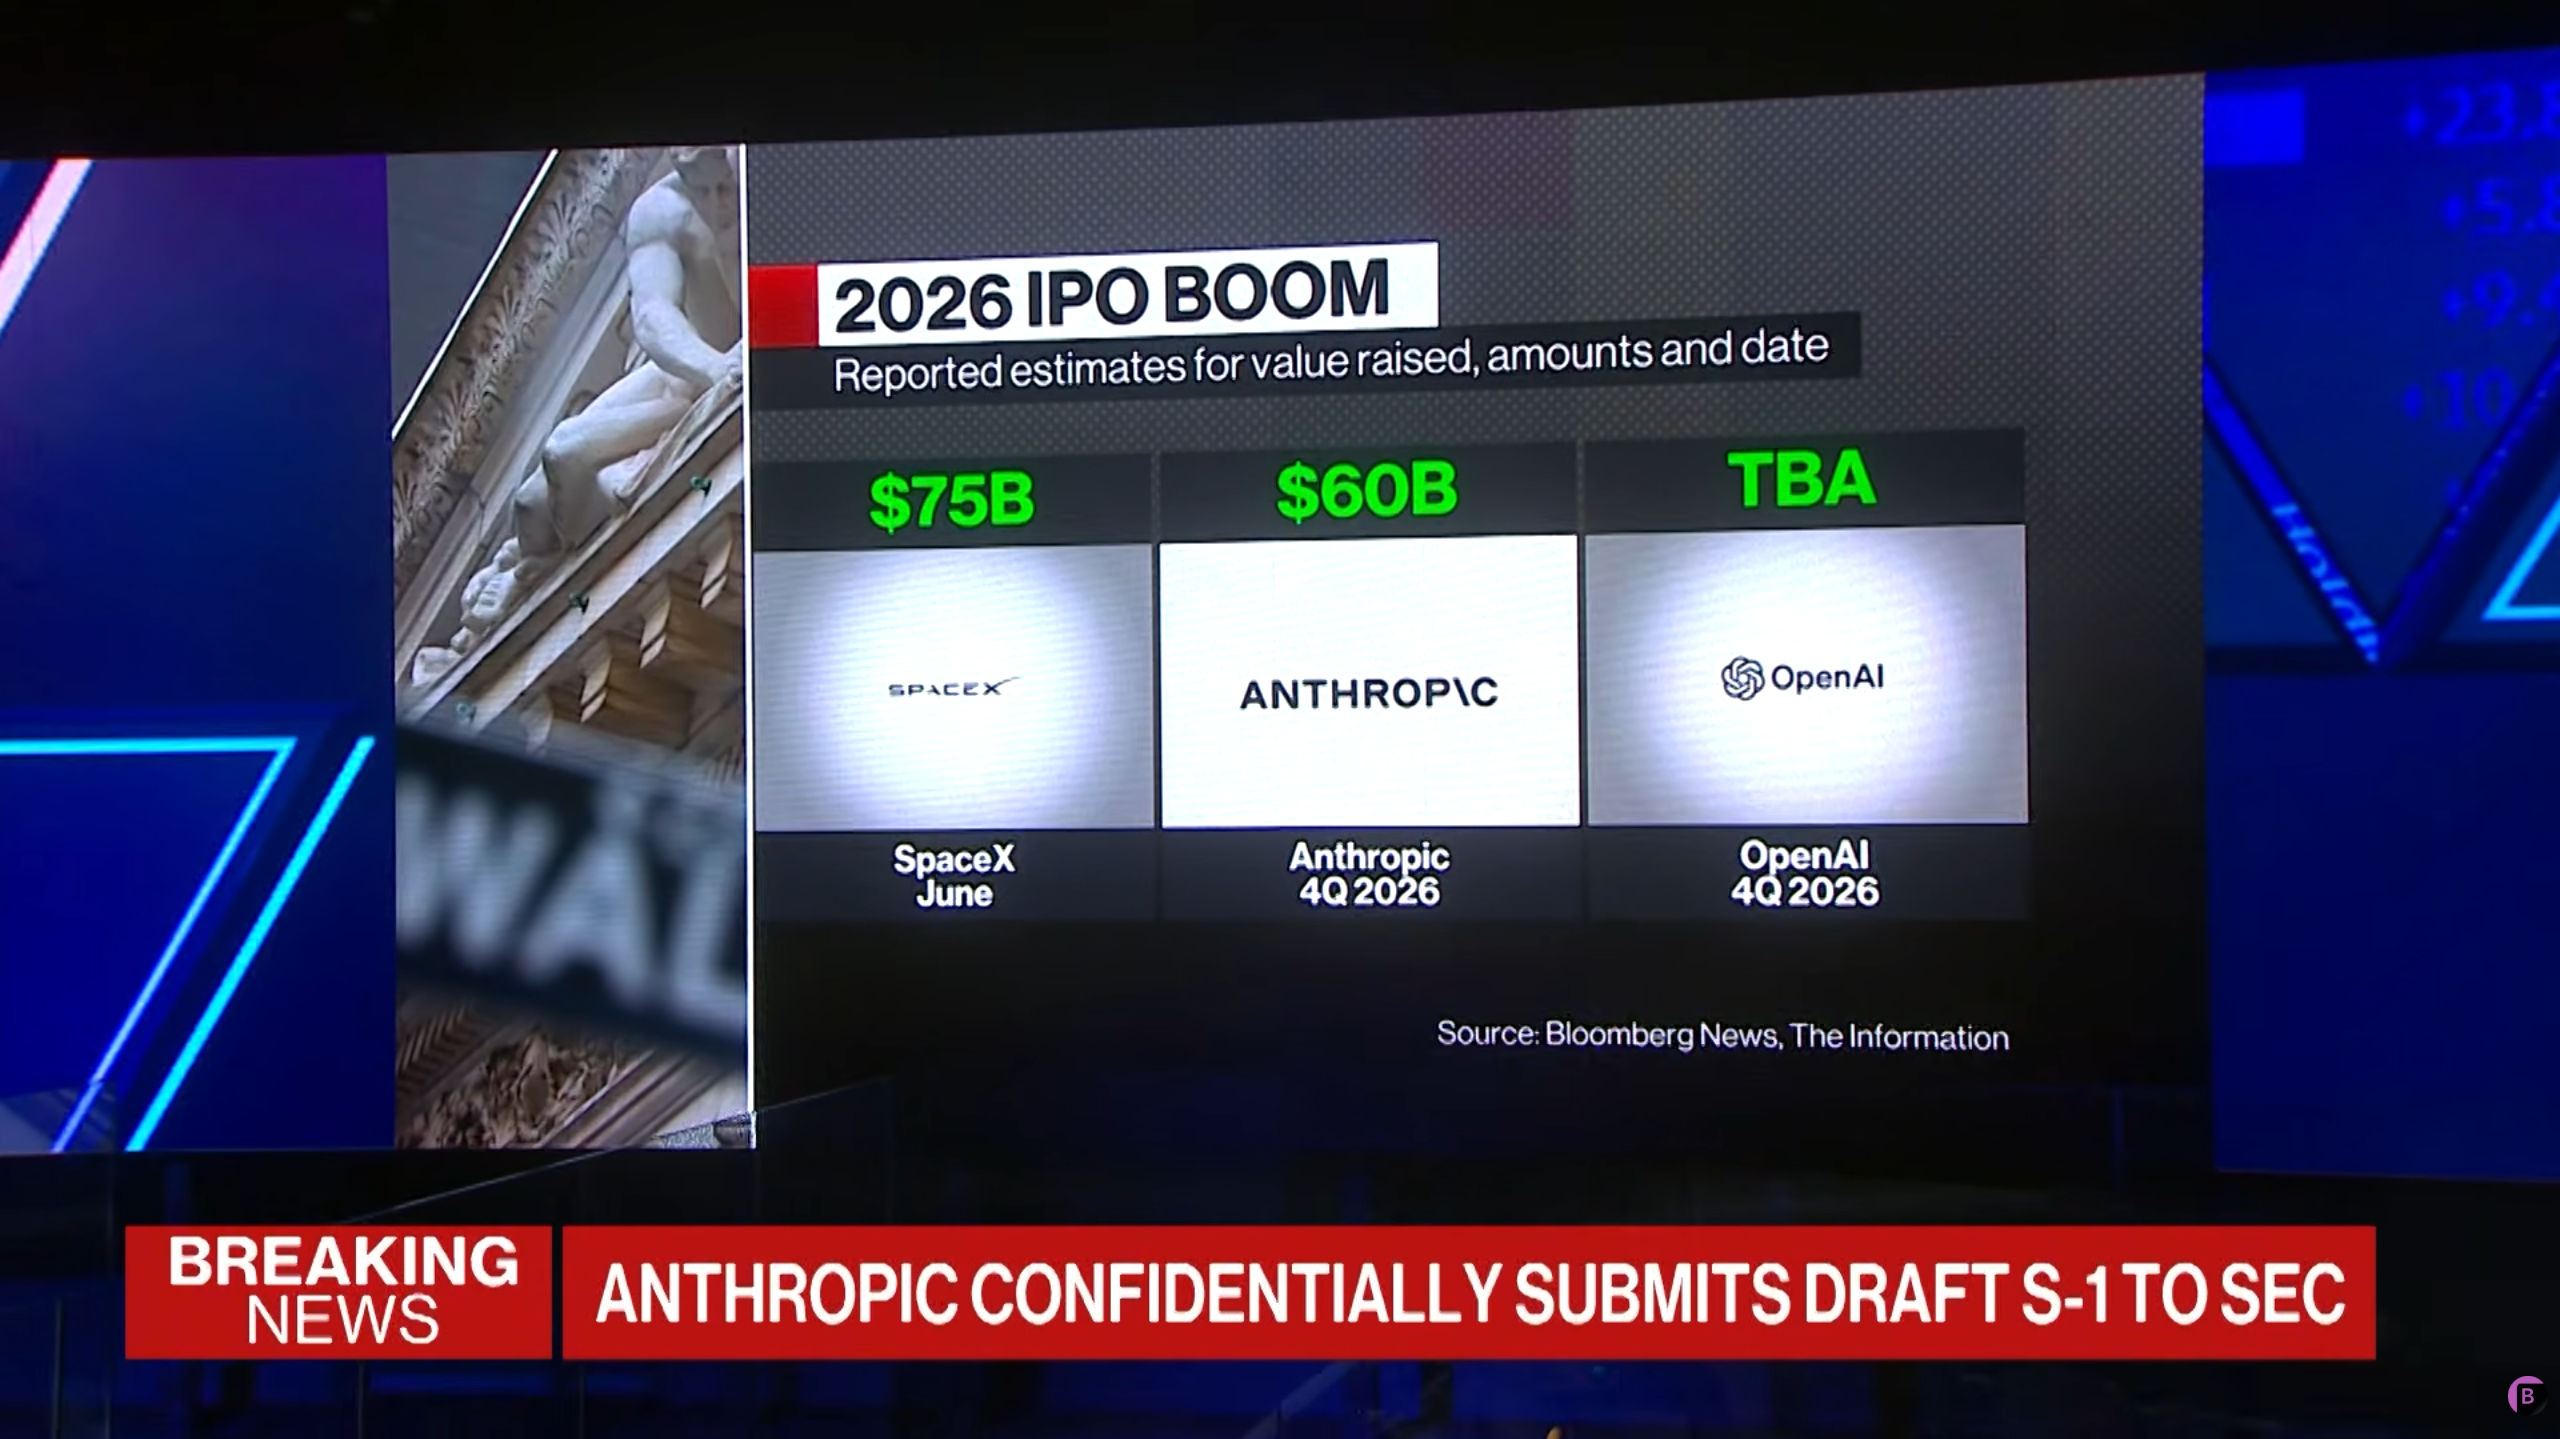
On the surface, three companies are simultaneously hitting the public markets; in reality, each has very different motives, constraints, and leverage.
Below are their core financial profiles.
Data Sources: SpaceX S-1 Filing (May 20, 2026), Bloomberg, Reuters, CNBC, TechStackIPO.com, The Information, Morningstar, NDTV Profit
| Core Metric |
SpaceX (SPCX) |
Anthropic |
OpenAI |
| Proposed Valuation |
$1.75-2T |
$965B |
$850B-1.1T |
| 2025 Revenue |
$18.7B |
$47B (Annualized) |
$13B (Estimated) |
| Net Profit / Loss |
-$4.94B |
Razor-Thin Margins |
-$14B (2026E) |
| Estimated Listing Date |
June 12, 2026 |
Fall 2026 (October) |
Q4 2026 / Delayed to 2027 |
| S-1 Filing Status |
✓ Publicly Filed |
◈ Confidential Draft Filing |
○ Not Formally Filed |
| Core Business Segments |
Space Launch, Starlink Communications, AI (xAI Merger) |
Enterprise LLMs, Safety & Compliance Systems |
Consumer Multimodal AI, API Ecosystem |
| Major Capital Backers |
Elon Musk (42% equity), Alphabet |
Amazon, Google, Sequoia Capital |
Microsoft, SoftBank, Thrive Capital |
Three-Year Revenue Comparison ($B)
| Company |
2023 |
2024 |
2025 |
3-Year CAGR |
| SpaceX |
$10.4B |
$14.0B |
$18.7B |
+34% |
| OpenAI |
$2.0B |
$6.0B |
$13.0B |
+155% |
| Anthropic |
$0.1B |
$0.4B |
$4.5B |
+620% |
Three-Year Net Profit / Loss Comparison ($B)
| Company |
2023 |
2024 |
2025 |
3-Year Total |
| SpaceX |
-$4.6B |
+$0.8B |
-$4.9B |
-$8.7B |
| OpenAI |
-$5.0B |
-$15.0B |
-$30.0B |
-$50.0B |
| Anthropic |
-$1.8B |
-$5.5B |
-$8.0B |
-$15.3B |
Revenue Growth and Profit Trends (2023→2025)
| Company |
2023→2024 Revenue Growth |
2024→2025 Revenue Growth |
2025 Loss / Revenue Ratio |
| SpaceX |
+34.6% |
+33.6% |
-26.2% |
| OpenAI |
+200% |
+117% |
-231% |
| Anthropic |
+300% |
+1025% |
-178% |
Starlink Contribution
$11.4B (61%)
Accumulated Deficit
$41.3B
SpaceX's real story is far more complex than "Elon Musk's space empire." In February 2026, SpaceX officially merged with Elon Musk's AI company xAI,
a decision that exposed a massive financial black hole hidden beneath the aerospace halo.
To build the "Colossus" super data center with 100,000 GPUs and gigawatt-level power consumption, and to develop the Grok large language model,
xAI burned more than $6 billion in 2025 and consumed another $2.5 billion in Q1 2026.
This caused SpaceX to report a single-quarter GAAP net loss of $4.28 billion in Q1 2026.
(Source: SpaceX S-1 Filing, May 20, 2026; Morningstar, May 21, 2026)
The underlying reason SpaceX is rushing to launch this $1.75-2 trillion "IPO of the century" (ticker SPCX) in mid-June
is to use public-market liquidity to quickly raise $40 to $80 billion in pure cash,
preventing xAI's compute drain from dragging down its core space and Starlink businesses.
Long-Term Hard Leases
$1.4T+
Cash Runway Limit
Mid-2027
OpenAI faces a classic "growth trap." Despite ChatGPT having more than 900 million weekly active users,
its monetization has never matched its cash burn. A representative case is its video-generation model Sora:
during operation, Sora consumed as much as $15 million per day in compute costs,
while generating only $2.1 million in lifetime revenue—implying a return of roughly $0.14 for every dollar spent,
an extremely unbalanced state.
More seriously, OpenAI has signed long-term data-center and hardware leases totaling more than $1.4 trillion with suppliers such as Nvidia and Oracle.
With an estimated 2026 net loss of $14 billion, HSBC estimates that OpenAI will still need to raise more than
$207 billion in external cash flow before 2030 just to maintain basic operations. The private venture market can no longer fund needs of this magnitude,
which is why the CFO favors delaying the IPO to 2027—they need more time to improve the financial statements.
(Source: The AI Journal, May 2026; RoboRhythms, May 22, 2026; HSBC Analyst Reports)
One notable signal: even before OpenAI's IPO preparations, more than 600 current and former employees had already sold shares worth
$6.6 billion on the secondary market. Wall Street analysts widely view this large-scale insider cash-out
as a tacit confirmation by senior management that the company's valuation is unsustainable.
(Source: The Information, Bloomberg)
Post-Series H Valuation
$965B
Annualized Revenue Run Rate
$47B
Q1 LLM Market Share
31.4%
The most striking story in this IPO race is Anthropic's "come-from-behind surge."
Founded in 2021 by siblings Dario Amodei and Daniela Amodei,
the company saw its post-money valuation soar to $965 billion after completing a massive $6.5 billion Series H round on May 28, 2026—
not only surpassing OpenAI's previous $85.2 billion private-market valuation in a very short time,
but also rewriting the valuation ceiling for global AI startups.
(Source: Anthropic Official Announcement, May 28, 2026; Bloomberg, Reuters, CNBC)
Anthropic's ability to overtake OpenAI lies in its diametrically opposite strategic positioning:
while OpenAI relies heavily on subscription users (ChatGPT Plus) and API calls in a "consumer-first" strategy,
Anthropic has invested 80% of its effort from the start in enterprise (B2B) customer development,
with only 20% of revenue coming from consumers. In Q1 2026 global LLM market revenue share,
Anthropic captured 31.4%, slightly overtaking OpenAI's 29.0%—a historic reversal.
(Source: Counterpoint Research Q1 2026; 36Kr, Jun 2, 2026)
Technically, Anthropic pioneered the "Constitutional AI" approach—by embedding a "constitutional" layer grounded in the Universal Declaration of Human Rights, business ethics, and transparency principles,
the model automatically evaluates, critiques, and self-corrects against constitutional rules during training. This yields extremely high predictability and consistency,
satisfying the rigid compliance and auditability demands of multinational banks, top law firms, and healthcare groups.
This has built an unshakeable moat in highly regulated scenarios such as finance, healthcare, and defense.
Part 03 — The Why
Why All Three Are Racing to List
The 2026 IPO wave is not a natural exit for unicorns after achieving success;
it is a "transfusion race" forced by an unprecedented capital-burning war. Behind each company lies an unavoidable compute black hole.
The essence of this IPO wave is not "cashing out after victory," but "cutting off an arm to survive"
OpenAI: Trillion-Dollar Debt Cliff and Sora's ROI Black Hole
OpenAI Crisis Transmission Chain
Multimodal Compute Demand
Expands Exponentially
Video / Physics Simulation
→
Sora ROI Only 0.14
Burns $15M/Day
Revenue $2.1M Total
→
$1.4T
Hard Leases
Irrevocable
→
2026E Loss
$14B
Cash Runs Out Mid-2027
→
Forced IPO
Needs $207B Before 2030
OpenAI's predicament can be summarized as the stacking of three layers: revenue below expectations, runaway compute costs, and crushing long-term debt.
In 2026, the company missed monthly revenue targets several times, and user growth stalled after hitting 900 million weekly active users.
At the same time, moving from simple "hundred-billion-scale text processing" to "million-dimensional multimodal physics simulation"
(such as video generation and autonomous physical agents) has pushed compute spending far beyond what traditional VC can support.
Sora's imbalanced production ratio is only the tip of the iceberg. The truly lethal factor is the $1.4 trillion in long-term data-center and server hard leases—
a legal obligation that must be honored regardless of revenue performance. HSBC's analysis notes that even accounting for current revenue growth,
OpenAI still needs to raise more than $207 billion in cash flow before 2030 just to maintain basic operations; otherwise it faces legal risk of compute default.
SpaceX: The "Financial Bomb" from the xAI Merger
SpaceX Crisis Transmission Chain
Feb 2026: Merged xAI
Strategic Expansion
→
Colossus Data Center
100K GPUs
Gigawatt Power
→
xAI Burns $8.5B+
2025: $6B
2026 Q1: $2.5B
→
Q1 Net Loss $4.28B
Accumulated Deficit $41.3B
→
Emergency IPO
$40-80B
Ticker SPCX
SpaceX's latest S-1 filing in May 2026 revealed for the first time the financial damage caused by the xAI merger in Q1 2026.
To build the Colossus super data center and develop the Grok model, xAI burned more than $6 billion and $2.5 billion in compute spending in 2025 and Q1 2026, respectively.
This directly caused SpaceX to report a staggering single-quarter GAAP net loss of $4.28 billion in Q1 2026, with the accumulated deficit reaching $41.3 billion.
SpaceX must raise as much as $40 to $80 billion in cash through the SPCX listing on Nasdaq
to sustain this compute black hole. Otherwise, xAI's continued bleeding will begin to erode the core Starlink cash flow—the only SpaceX business unit currently generating positive cash flow.
Anthropic: $15 Billion/Year in Rigid Liability Payments
Anthropic Crisis Transmission Chain
Enterprise Market Success
Q2 Revenue Run Rate $10.9B
→
Compute Supply Chain Locked In
Google / Amazon
Hundreds of $B Contracts
→
SpaceX Leases
$15B/Year
Series H $6.5B
Not Enough for Half-Year Rent
→
Rigid Payment Pressure
Even Zero R&D
Still Needs $15B/Year
→
Forced October IPO
$965B Valuation
Relief Transfusion
Although Anthropic has achieved great success in the enterprise market thanks to "Constitutional AI" and Project Glasswing, with Q2 revenue run rate expected to reach an astonishing $10.9 billion,
it is also locked into extremely expensive compute supply chains. In addition to hundreds of billions of dollars in compute and chip contracts signed with Google, Broadcom, and Amazon,
Anthropic signed a particularly heavy contract with SpaceX in May 2026: leasing two orbital and ground data-center clusters from SpaceX for $15 billion per year.
This means that even if Anthropic does no R&D at all, it faces $15 billion per year in rigid payment obligations just for the SpaceX lease.
The $6.5 billion raised in Series H is not even enough to cover half a year of data-center rent. Therefore, Anthropic must rush an IPO in October at a near-trillion-dollar valuation,
using the public market's endless cheap capital to "relay-transfuse" these sky-high long-term leases.
⚠️ Hidden Financial Engineering: Cloud Credits Circular Financing
In this AI upstart IPO feast, a financial engineering technique called "Cloud Credits Circular Financing" is systematically distorting supply-and-demand signals in the capital markets.
Tech giants (Microsoft, Google, Amazon, Nvidia) inject capital into AI startups in the name of "investment," but the capital is not cash—it is issued as monopolistic cloud-service credits (Cloud Credits).
These startups are forced to use the credits to buy compute from the investor, and the money flows back to the giant in the form of "server/chip purchases," recorded as the giant's "cloud business revenue."
The same dollar is counted twice—once as investment, once as revenue—manufacturing false demand signals and valuation bubbles.
Source: Blockonomi (May 2026); Tech Policy Press (Apr 14, 2026); Morningstar (May 6, 2026); Built In (Apr 21, 2026)
| Circular Financing Case |
Investor |
Investment Amount |
Recycling Commitment |
Recycling Mechanism |
| Microsoft ↔ OpenAI |
Microsoft |
$13B |
OpenAI Cloud Spend $60B+/Year |
Azure credits → OpenAI buys Azure compute → Microsoft books cloud revenue |
| Amazon ↔ Anthropic |
Amazon |
$13B (Cumulative) |
AWS Compute Commitment $100B |
Investment-to-spend ratio reaches 20:1; capital flows back to AWS |
| Alphabet ↔ Anthropic |
Google |
$40B (Committed) |
Google Cloud 5GW Compute |
Google Cloud provides compute → Anthropic spend booked as Google Cloud revenue |
| Nvidia ↔ CoreWeave |
Nvidia |
$2B (Added Jan 2026) |
$6.3B Chip Purchase Order |
Nvidia invests → CoreWeave buys Nvidia chips → Nvidia books chip revenue |
| Oracle ↔ OpenAI |
Oracle |
— |
$300B GPU/Cloud Transaction |
OpenAI raises capital → funds flow to Oracle → Oracle stock surges |
Paper Profit vs. Real Cash Flow: A Shocking Contrast
The toxic fruit of this circular financing is directly visible in the giants' financial statements. Alphabet reported a record $62.6 billion profit in Q1 2026, but $28.7 billion of it (nearly half) came from paper gains on its own mark-to-market Anthropic equity holdings—not from actual revenue in Search, YouTube, or Cloud.
In the same quarter, Amazon reported $30.3 billion in profit, of which $16.8 billion similarly came from unrealized valuation gains on Anthropic equity.
Yet Amazon's free cash flow plummeted 95% to just $1.2 billion—because the company spent $44.2 billion building physical data centers.
The broader systemic risk is that OpenAI and Anthropic together account for more than half of the $2 trillion in future cloud backlog orders at Microsoft, Oracle, Google, and Amazon.
Microsoft's $13 billion OpenAI investment was issued as Azure credits, and OpenAI's annual cloud spend ($60 billion) is already more than twice its own revenue ($25 billion);
54% of Oracle's $553 billion pipeline depends on the single customer OpenAI.
These "paper profits" contrast starkly with collapsing free cash flow, and analysts have compared this pattern to Global Crossing and Qwest Communications during the 2001 dot-com bubble—when the two companies swapped fiber capacity to manufacture fake sales, ultimately leading Qwest to write off $1.4 billion in revenue and Global Crossing to file for bankruptcy.
Source: HumAI Blog (May 2026); FourWeekMBA (Apr 21, 2026); Blockonomi (May 2026); TipRanks (May 2026); CoreWeave Official Press Release (Jan 26, 2026)
A tech giant pours billions of dollars into an AI startup as an "investment," but the contract contains hidden strict terms forcing that startup to hand the exact same money straight back to the tech giant to rent their computer servers.
— BullTheoryio, Twitter/X (May 23, 2026); cited in Blockonomi / Morningstar analysis reports
Regulatory Attention: The U.S. Federal Trade Commission (FTC) documented these financial relationship patterns in AI partnerships in its January 2025 report.
Senators Elizabeth Warren and Ron Wyden argue that cloud-AI partnerships amount to "functional mergers that evade antitrust review."
Tech Policy Press calls this dynamic the "Cloud Credit Circuit" and notes:
"When a startup's cloud consumption is pre-funded by the cloud provider itself, the resulting usage statistics are real on the balance sheet but do not reflect arm's-length transactions."
Source: Tech Policy Press (Apr 14, 2026); FTC Report on AI Partnerships (Jan 2025); Bloomberg "AI Circular Deals" reporting
In-Depth Financial Health Comparison
| Financial Indicator |
SpaceX |
Anthropic |
OpenAI |
| 2025 Revenue |
$18.7B |
$47B (Annualized) |
$13B (Est.) |
| 2026E Net Loss |
-$17.1B+ |
-$5B (Est.) |
-$14B |
| Accumulated Deficit / Debt |
$41.3B |
$20B+ |
$1.4T (Leases) |
| Cash Runway (No New Funding) |
~12 Months |
~8 Months |
~18 Months |
| Valuation / Revenue Ratio |
93.6x |
20.5x |
65.4-84.6x |
| Main Cash Consumption Item |
xAI Compute ($8.5B+/Year) |
Data Center Rent ($15B/Year) |
GPU Leases ($30B+/Year) |
| Only Profitable Business |
Starlink (Positive Cash Flow) |
Enterprise API (Positive Gross Margin) |
None |
Annual Losses vs. Long-Term Commitments Comparison ($B)
The current IPO frenzy is essentially an enormous "risk transfer exercise." The paper wealth built up through inflated private valuations
is being packaged and passed on to ordinary public investors through a high-difficulty public offering.
— Michael Hartnett, Chief Investment Strategist, Bank of America
Part 04 — Macro Context
Why Now? Three Macro Drivers
The 2026 IPO boom is not a coincidence; it is the inevitable result of three macro forces converging.
Understanding these deeper drivers is essential to seeing the true nature of this capital game.
Severe Distortion of the Capital-Output Ratio
Think tanks and short sellers keep showing the market a set of deeply uncomfortable numbers:
Capital-Output Ratio
=
Annual AI Infrastructure Spending
Annual Real Generative AI Revenue
≈
$500 Billion
$12 Billion
≈
42: 1
This astonishing figure far exceeds the telecom fiber overbuild imbalance of the dot-com era. 95% of enterprise AI projects generate zero return, causing widespread panic and capital withdrawals among limited partners (LPs) in private venture. As private equity markets dry up and valuations face down-round pressure, rushing to list on public markets has become the only exit path for early-stage VCs and Silicon Valley insiders.
Data Source: MIT NANDA Report "The GenAI Divide: State of AI in Business 2025" (Jul 2025); Sequoia Capital Analysis (Jun 2025)
Macro Driver Chain
1
The AI Arms Race Enters the "Bottomless Compute Pit" Phase
Large models are moving from "hundred-billion-scale text processing" to "million-dimensional multimodal physics simulation" (video generation, autonomous physical agents). Compute spending is expanding exponentially, far exceeding the carrying capacity of traditional VC. OpenAI's Sora burns $15 million per day in compute costs while generating only $2.1 million in lifetime revenue—a return of just $0.14 per dollar spent.
2
Private Markets Dry Up, Valuations Face Down-Round Pressure
With 95% of enterprise GenAI projects generating zero return, LPs in private venture are panicking and withdrawing capital en masse. The 42:1 capital-output imbalance far exceeds the 2000 dot-com bubble. As private equity markets dry up and valuations face down-round pressure, public markets become the only "escape hatch."
3
Index-Inclusion Rule Arbitrage: Passive Money as "Determined Buyer"
To accommodate the concentrated arrival of trillion-dollar IPOs such as SpaceX, OpenAI, and Anthropic, Nasdaq (March 30, 2026) and S&P 500 (April 30, 2026) successively revised their index inclusion criteria, drastically shortening the observation period for mega-cap unprofitable giants and removing the continuous profitability threshold. SpaceX and Anthropic will be forced into key benchmarks such as the S&P 100 and Nasdaq-100 just 15 trading days after listing. Retirement funds and index ETFs worth trillions of dollars worldwide must buy them unconditionally.
42:1
Capital-Output Imbalance
$500B invested vs $12B revenue
Source: Sequoia Capital, Jun 2025
95%
GenAI Projects with Zero Return
MIT NANDA 2025 Report
Source: MIT, Jul 2025
90%
Enterprises Say AI Has No Material Impact
NBER Survey of 6,000 Executives
Source: NBER w34836, Feb 2026
15 Days
Index Inclusion Observation Period
New Nasdaq Rule
Source: Nasdaq, Mar 2026
Transmission Logic from Macro Drivers to Micro Behavior
Macro Layer
Exponential AI compute demand growth
Private LP panic and capital withdrawal
Index rule arbitrage space
↓
Meso Layer
VC capital cannot sustain compute black holes
Valuations face down-round pressure
Public markets become the only solution
↓
Micro Layer
Three companies forced to sprint to IPO simultaneously
Use 5% free-float rule to minimize dilution
Rely on passive index money to "backstop" valuations
This extremely dense financing demand has triggered sharp divisions among investment banks, academic think tanks, and authoritative media,
becoming the one of the most polarizing forces in the 2026 macro financial market.
To understand the essence of this storm, we must first see each company's situation clearly.
Part 05 — The Debate
How Wall Street Views This
This extremely dense financing demand has triggered sharp divisions among investment banks, academic think tanks, and authoritative media.
Two opposing camps have emerged: one warns this is the largest asset bubble in history, while the other insists it is a genuine productivity payoff.
| Institution / Analyst |
Camp |
Core View |
Key Data |
| BofA Michael Hartnett |
Bearish |
"Super Bubble" warning: tech sector weight will break the 48% red line |
Concentration exceeds 1920s / 1970s / 1980s Japan / 2000 TMT |
| Citigroup |
Bearish |
Liquidity crowding-out concerns |
Trillion-dollar capital absorption will create market funding gaps |
| Morgan Stanley Thomas Kamei |
Bullish |
Not a replay of the 2000 bubble; supported by solid cash flows |
Enterprise software revenue directly tied to cloud capex |
| JPMorgan Research |
Bullish |
AI investment directly linked to real enterprise revenue |
Core value will accrue to physical enterprises applying AI |
| St. Louis Fed |
Neutral Data |
AI investment contributed 0.97 percentage points to GDP growth |
Represents 39% of overall 2.51% growth rate |
| NBER (Feb 2026) |
Bearish |
90% of enterprises say AI has no material impact |
Expected 1.4% productivity gain vs. actual zero output |
⚠ Bearish Camp: The "Super Bubble" Thesis
-
BofA's Michael Hartnett issued a stern warning: the concentrated listings of SpaceX, OpenAI, and Anthropic
will push the tech sector's total weight in the S&P 500 beyond the 48% historical red line.
-
This concentration has already exceeded several extreme bubble peaks in modern financial history: the Roaring Twenties of the 1920s, the Nifty Fifty of the 1970s,
the late-1980s Japanese asset bubble, and the 2000 TMT internet bubble.
-
Essential judgment: This is an enormous "risk transfer exercise"—paper wealth built up in private markets is being passed on to ordinary public investors, retail investors, and pension funds.
-
Citigroup also expressed concern about liquidity crowding-out, arguing that such dense trillion-dollar capital absorption will create significant funding gaps in the market.
✓ Bullish Camp: The Productivity Payoff Thesis
-
Morgan Stanley Counterpoint Global's Thomas Kamei argues:
the current AI wave is not a replay of the 2000 dot-com bubble. Internet companies in the 2000s generally lacked real revenue support,
whereas the 2026 AI Big Three have extremely solid cash flows and highly sticky commercial customer bases.
-
JPMorgan research shows that current AI investment is not hollow speculation,
but is directly tied to real enterprise software revenue and cloud computing capital expenditure.
-
Core logic: In every major technology wave, core value not only flows back to technology suppliers,
but also accrues to physical enterprises that actively apply the technology through higher operating leverage and productivity.
Academic Think Tanks' "Productivity Paradox" Assessment
Data Sources: Federal Reserve Bank of St. Louis; NBER Working Paper 34836 (Feb 2026); MIT NANDA Report (Jul 2025); Economic Times (Feb 18, 2026)
Compared with the highly conflicted positioning of investment banks, neutral academic think tanks and macro-financial regulators focus more on real-economy feedback loops.
According to the Federal Reserve Bank of St. Louis, AI-related investment contributed 0.97 percentage points to U.S. real GDP growth in 2025,
accounting for a remarkable 39%39% of the 2.51% overall annualized growth rate.
By comparison, internet bubble investment contributed only 0.81 percentage points (28%) to U.S. GDP in 2000.
This shows the current macroeconomy is deeply dependent on AI investment.
However, NBER's in-depth study published in February 2026 reveals a worrying paradox:
although executives across industries generally claim AI will drive 1.4% productivity gains and 0.8% output increases in the future,
in actual surveys, as many as 90% of enterprises reported that AI "has not yet had any material, observable impact on current workplaces or productivity."
MIT's assessment report published in the second half of 2025 further notes: among GenAI projects launched inside major enterprises,
nearly 95% of projects consumed a total of $30-40 billion in investment while still producing zero output.
S&P Global's model predicts that once this infrastructure-stacking productivity illusion bursts,
the resulting technical adjustment could cause as many as 2.5 million jobs to disappear across the United States in a chain reaction.
Historical Bubble Comparison: 2026 vs. 2000 Dot-Com Bubble
| Comparison Dimension |
2000 Dot-Com Bubble |
2026 AI IPO Boom |
| Peak Total Market Cap |
$3.5T (NASDAQ) |
$3T (Three Companies Alone) |
| Average Valuation / Revenue Ratio |
~50x |
20-94x |
| Profitability |
Most companies had zero revenue |
Have revenue but massive losses |
| Capital-Output Ratio |
~15:1 |
42:1 |
| GDP Contribution |
0.81pp (28%) |
0.97pp (39%) |
| Real Enterprise Adoption |
~30% had real websites |
90% report no material impact |
| Post-Crash Decline |
NASDAQ -78% |
? |
42:1
Capital-Output Imbalance
(Far Exceeds 2000 Dot-Com Bubble)
95%
GenAI Projects with Zero Return
90%
Enterprises Say AI Has No Material Impact
$450B
BofA AI Credit Commitments
(25% of Tier 1 Capital)
Part 06 — The Mechanism
Passive Backstop Mechanism: The Hidden Channel of Index Arbitrage
In this IPO boom, there is a widely overlooked but crucial structural factor:
the modern passive index investing system provides these AI giants with an almost deterministic liquidity channel.
According to internal details disclosed by the Financial Times, to accommodate the concentrated arrival of trillion-dollar IPOs such as SpaceX, OpenAI, and Anthropic,
Nasdaq (announced March 30, 2026) and S&P 500 (launched consultation April 30, 2026) successively revised their index inclusion criteria,
drastically shortening the observation period for mega-cap unprofitable giants and removing the hard threshold of continuous profitability.
This means that SpaceX (ticker SPCX) and future Anthropic, after listing for just 15 trading days,
will be forced into key benchmarks such as the S&P 100 and Nasdaq-100.
Because retirement funds, pension funds, and index ETFs (such as SPY, QQQ) worth trillions of dollars worldwide must unconditionally buy and hold index constituents—
this mechanism essentially ensures that regardless of how severe these AI giants' fundamental losses are,
after listing there will be an extremely large pool of passive public capital entering to "backstop" them, providing a deterministic liquidity channel for early high-risk venture investors.
Rule Revolution: From "Strict Screening" to "Wide Open"
| Index |
Rule Dimension |
Old Rule (Pre-2026) |
New Rule (2026 Revision) |
Change Magnitude |
| S&P 500 |
Listing Time Requirement |
At least 12 months |
6 months (Mega IPOs) |
Shortened 50% |
| Profitability Requirement |
Recent quarter + four consecutive profitable quarters |
Profitability requirement removed |
Fully eliminated |
| Free-Float Requirement |
At least 50% publicly floated |
10% minimum threshold removed |
Threshold greatly lowered |
| Nasdaq-100 |
Observation Period |
180 days (~6 months) |
15 trading days |
Shortened 92% |
| Market Cap Ranking |
Top 100 non-financial stocks |
Top 40 for fast-track inclusion |
Standard relaxed 60% |
| FTSE Russell |
Inclusion Timing |
Wait for quarterly review |
5th trading day |
From months to 1 week |
| Assessment Standard |
Quarterly rebalance |
Dynamic quarterly threshold |
Real-time response |
Extreme Contrast of Rule Relaxation
Using SpaceX as an example, compare the inclusion path under old and new rules:
Under Old Rules
:
12-month observation + profitability proof + 50% free float
Under New Rules
:
6-month observation + no profit required + 5% free float sufficient
This means a company losing $4.94 billion and issuing only 5% free float
can be included in the Nasdaq-100 just 15 trading days after listing,
whereas under the old rules this company would not meet any inclusion condition.
Passive Backstop Mechanism: Four-Step Arbitrage Process
Step 1: List
Only 5% free float required
No profitability record needed
→
Step 2: Wait 15 Days
Triggers new index inclusion rule
Automatically enters watchlist
→
Step 3: Forced Index Inclusion
S&P 100 / Nasdaq-100
Automatically absorb as constituent
→
Step 4: Passive Money Backstop
Trillions of dollars in retirement funds
ETFs forced to buy by weight
| Index / Fund |
Assets Under Management |
Mandatory Purchase Mechanism |
Estimated Inflow |
| S&P 500 ETF (SPY) |
$600B+ |
Allocate by market-cap weight after inclusion |
$15-30B |
| NASDAQ 100 (QQQ) |
$300B+ |
Tech stock mandatory allocation |
$10-20B |
| Global Pension Funds |
$50T+ |
Benchmark-tracking obligation |
$50-100B |
| 401(k) Retirement Plans |
$7T+ |
Target-date fund automatic rebalancing |
$5-10B |
| Total Estimate |
— |
— |
$80-160B |
Step 1: List
Only 5% extremely low free float required to meet listing conditions; no profitability record needed.
Step 2: Wait 15 Trading Days
Triggers the new index inclusion criteria and automatically enters the watchlist.
Step 3: Forced Inclusion in Benchmark Indices
Automatically absorbed as a constituent by the S&P 100, Nasdaq-100, and other major indices.
Step 4: Trillions in Passive Money Forced to Buy
Global pension funds and index ETFs must allocate by weight, creating unconditional buying support.
Wealth Transfer Mechanism: From Retail and Pension Funds to Insiders
Wealth Transfer Chain from Ordinary People to Billionaires
1
Private Stage: Insiders Accumulate at Low Prices
Founders, early VCs, and employees accumulate large stakes at extremely low valuations (SpaceX was only $3.3B in 2019). Musk holds 42% equity at near-zero cost.
2
Choose the Valuation Peak for IPO
Companies only go public when they believe they can fetch the highest valuation. SpaceX inflated from $3.3B → $1.75T, a 52-60x expansion. OpenAI inflated 85-110x.
3
Index Providers Modify Rules for Fast Inclusion
Nasdaq, S&P, FTSE Russell, and others densely modify rules, compressing inclusion time from 12 months to 5-15 days and removing profitability and free-float requirements.
4
Passive Funds Forced to Buy at High Prices
$12 trillion in global index money is forced to buy by weight, creating deterministic liquidity for insiders. Retail investors bear the cost indirectly through 401(k)s and pensions.
The current IPO frenzy is essentially an enormous "risk transfer exercise."
The paper wealth built up through inflated private valuations is being transferred, through systematic index rule changes,
to ordinary public investors, retail investors, and pension funds.
— Michael Hartnett, Chief Investment Strategist, Bank of America
Historical Data: IPOs Are Poor Investments
| Study / Indicator |
Time Range |
Key Finding |
| Long-Term IPO Performance |
1991-2018 |
IPO portfolios underperformed the market by ~2% annually |
| Secondary Market IPO Investment |
1980-2023 |
Holding for 3 years underperformed the market by 19 percentage points on average |
| Low Free-Float IPOs |
Historical Statistics |
IPOs with 5% free float underperformed their first-day closing price by over 60% within 3 years on average |
| Front-Running Costs |
2025 Research |
Hedge fund front-running drags index fund performance by 0.47%-0.70% annually |
| Insider Cash-Out |
OpenAI Case |
600+ employees sold $6.6B in shares early |
Regulatory Vacuum: An Unwatched Casino
Index providers (S&P Dow Jones, Nasdaq, MSCI, FTSE Russell) are private companies,
and their index methodologies are not directly regulated by the SEC. This means:
1. Rule changes require no regulatory approval—index providers can decide when and how to modify inclusion rules
without review or approval from any government agency.
2. Conflicts of interest go unsupervised—Nasdaq is both an exchange and an index provider,
with a strong incentive to modify rules to attract large IPOs to its platform.
3. SEC stance: encourage rather than regulate—SEC Chairman Paul Atkins has explicitly said he wants to "make IPOs great again,"
and deregulation is the main theme, not protecting passive investors.
4. Index committee black-box operations—actual S&P 500 inclusion decisions are made by the index committee at its "sole discretion,"
with non-transparent processes and non-public criteria.
Part 07 — Index Rule Changes
Index Rule Changes: A Carefully Designed Wealth Transfer
In 2026, major U.S. index providers revised in quick succession IPO inclusion rules. On the surface, this was to "better reflect the market";
in reality, it opened a high-speed channel for giant IPOs to flow money from ordinary people's wallets into billionaires' pockets.
This is not an improvement in market efficiency, but an unregulated structural arbitrage.
Data Sources: Nasdaq Official Announcement (Mar 30, 2026), Ashurst Legal Analysis (Apr 16, 2026), Bloomberg Linea, Xueqiu, LongPort, StockWireX
Index Provider Rule Change Comparison
| Index Provider |
Change Date |
Original Rule |
New Rule |
Applicable To |
| Nasdaq-100 |
Mar 30, 2026 announced
Effective May 1 |
180-day observation period |
15 trading days |
Top 40 IPOs by market cap |
| S&P 500 |
Late Apr 2026 consultation
Planned early Jun 2026 effective |
12 months + profitability + 10% free float |
6 months + no profit requirement + no free-float threshold |
"Mega IPOs" with market cap ≥ $200B |
| FTSE Russell |
May 27, 2026 announced |
Wait for quarterly review |
5th trading day |
Investable market cap exceeds Top 500 threshold |
| MSCI |
Clause in place since 2017 |
Standard quarterly inclusion |
10th trading day |
IPOs meeting size criteria |
| CRSP (Vanguard) |
In place since 2017 |
Standard inclusion process |
T+4 (4 trading days) |
Above micro-cap threshold (~$2B) |
Nasdaq 5x Multiplier Rule: The "Nuclear Weapon" for Low Free Float
The most controversial rule proposed by Nasdaq is the "5x multiplier" mechanism: for companies with a free float below 20%,
index weight = actual free float ratio × 5 (capped at 100%). This means:
| Actual Free Float |
Multiplier |
Index Weight Calculation Base |
| 5% |
×5 |
25% |
| 10% |
×5 |
50% |
| 15% |
×5 |
75% |
| 20% |
×5 (capped) |
100% |
Extreme Distortion of SpaceX Index Inclusion
Suppose SpaceX IPOs at a $1.75 trillion valuation, issuing only 5% free float (~$87.5 billion):
Actual Float Market Cap
=
$1.75T × 5%
Tradable Shares
=
$87.5B
Weight Base After 5x Multiplier
=
$87.5B × 5
Nasdaq-100 Total Market Cap
≈
25%
This means passive funds such as QQQ will be forced to allocate about 25% of their capital to SpaceX,
while the actual tradable stock in the market is worth only $87.5 billion. $12 trillion in index money chasing $87.5 billion in free float—
this is an unprecedented liquidity mismatch in modern financial history.
Possible Outcomes of Unregulated Runaway
Short Term
Severe Price Distortion
$12 trillion in index money chasing 5% free float creates a "firehose effect."
Hedge funds front-run, driving up index fund purchase costs.
Retail investors bear 0.47%-0.70% annual hidden cost
Medium Term
Crash After Lock-Up Expiry
After insider lock-up periods expire, large blocks are unlocked, and index rebalancing is forced to absorb them.
Historical data for low free-float IPOs shows average declines exceeding 60% within 3 years.
401(k)s and pension funds shrink sharply
Long Term
Systemic Trust Crisis
If multiple mega-IPOs break issue price simultaneously, it could trigger a chain sell-off in tech stocks
and a wave of bad debts in bank AI lending, replaying a 2000-style crisis.
NASDAQ could fall more than 60%
5%
SpaceX Expected Free Float
25%
Index Weight After 5x Multiplier
$240-480B
Forced Passive Fund Purchases
Part 09 — Conclusion
Echoes of History: The Mirror of the AI Bubble and the Internet Bubble
The 2026 AI IPO boom led by SpaceX, OpenAI, and Anthropic forms a stunning historical mirror image with the internet bubble of twenty-five years ago.
Both bubbles carried grand narratives of technological revolution, both experienced capital frenzy, and both face the ultimate test of productivity delivery.
Yet the true value of history lies not in simple analogy, but in understanding the subtle and dangerous dividing line between technological revolution and capital bubble.
Structural Comparison of the Two Bubbles
| Dimension |
2000 Internet Bubble |
2026 AI Bubble |
| Core Narrative |
The Internet will change all business models |
AI will replace human intellectual labor |
| Capital-Output Imbalance |
Fiber buildout : revenue ≈ 10:1 |
Compute spending : revenue ≈ 42:1 |
| IPO Characteristics |
Batch listing of ".com" companies, most with no revenue |
Concentrated listing of trillion-dollar giants, massive losses |
| Index Manipulation |
Active funds chasing tech stocks |
Passive indexes forced to take the other side, retail has no choice |
| Infrastructure |
Fiber, data centers (physical assets) |
GPU clusters, compute centers (rapid depreciation) |
| Post-Burst Legacy |
Rise of Amazon and Google; broadband penetration |
Unknown — could be compute overcapacity or AGI breakthrough |
Productivity Leap: The Real Gift of the Technological Revolution
After the internet bubble burst, the market left behind physical infrastructure worth trillions of dollars — transoceanic fiber, data centers, broadband networks.
This "excess" capacity became the physical cornerstone of the digital economy for the next two decades. Amazon's stock price plunged 90% after the bubble burst,
yet it used cheaply acquired server infrastructure to build the world's largest cloud computing empire; Google reshaped information retrieval and ad distribution relying on widespread broadband networks.
Only after the cruel screening of the bubble could the real productivity revolution unfold.
If the AI bubble follows a similar path, its potential legacy may be even more profound. Generative AI has already demonstrated speed advantages surpassing human experts in code generation, drug discovery, materials science,
and climate simulation. Even if 95% of enterprise AI projects currently generate zero returns,
the remaining 5% — such as Anthropic's Project Glasswing in sovereign cybersecurity and SpaceX applying AI to spacecraft autonomous navigation —
may be gestating the core productivity tools of the next era. The key difference: internet infrastructure was "general-purpose,"
while AI compute investment is highly specialized; once the technical route is wrong, hundreds of billions of dollars of GPU clusters will rapidly become electronic waste.
+64%
U.S. labor productivity growth in the decade after the internet bubble
Source: BLS, 2000-2010
$1.5T
Global cloud computing market size (2025)
Source: Gartner, 2025
?
Productivity legacy after the AI bubble
To be verified by history
The Heavy Lesson of 2000: The Burst Is Not a Gentle Correction
The NASDAQ Composite Index crashed from 5,048 in March 2000 to 1,114 in October 2002, a drop of 78%.
This is not a "correction," but a devastating wealth wipeout for a generation. Trillions of dollars of market cap evaporated,
with the vast majority borne by retail investors — attracted into the market at the bubble peak by the "new economy" narrative,
and forced to cut losses at the desperate bottom. The deeper impact is that an entire generation of engineers and entrepreneurs lost confidence in technological innovation,
the venture capital industry fell into a five-year deep freeze, and numerous early-stage projects that could have changed the world died due to broken capital chains.
The risks in 2026 may be more hidden and systemic. BofA's AI credit commitments of up to $450 billion account for 25% of its Tier 1 capital,
meaning a bubble burst would directly threaten banking system stability. Unlike 2000, today's tech stock concentration has reached an historical extreme —
tech stocks' weight in the S&P 500 has broken through 48%. Once AI giant stock prices crash, passive index funds will be forced to sell other constituents to maintain weight balance,
triggering cross-sector chain crashes. Pensions, 401(k) retirement plans, university endowments — these funds that should be the most conservative —
are deeply tied to this gamble by the "mechanicity" of index investing.
2000 vs 2026: Burst Transmission Mechanism Comparison
2000:
Active Funds
Chasing and Dumping
→
Retail Directly
Buy Individual Stocks
Losses Self-Borne
→
Impact Scope
Relatively Limited
Mainly Tech Stocks
↓ 2026 Mechanism More Dangerous ↓
2026:
Passive Index
Mandatory Inclusion
→
Pension/ETF
Unconditional Takeover
Retail Has No Choice
→
Systemic
Cross-Sector
Chain Collapse
The Most Dangerous Harvest: "Certain Takeover" Under the Passive Index Mechanism
In this bubble, what is most infuriating is not the overvaluation, but the institutionalized wealth-transfer mechanism.
Nasdaq and the S&P 500 successively revised index inclusion rules in 2026, shortening the observation period for mega-cap unprofitable giants from several years to 15 trading days,
and eliminating the continuous profitability threshold. This is not a neutral "market-rule adjustment," but an exit channel tailor-made for specific interest groups.
When SpaceX and Anthropic are forcibly included in key benchmarks such as the S&P 100 and Nasdaq-100 just 15 days after listing,
trillions of dollars of global retirement funds and index ETFs must buy unconditionally — regardless of whether their valuations are reasonable,
regardless of whether their business models are sustainable, regardless of whether retail investors are willing. The essence of this "passive takeover" mechanism
is to transfer the exit risk of early VCs, founders, and insiders through the "mechanicity" of index investing,
forcibly shifting it onto every ordinary worker who pays into a pension.
This is the most elegant and coldest wealth harvest in modern financial history: equity acquired by early capital for pennies
is sold to the public market at hundreds of dollars of valuation at IPO; and when stock prices eventually return to fundamentals,
those who bear the losses are index-fund holders who never actively chose to invest in these companies —
teachers, nurses, firefighters, factory workers' retirement savings. The capitalists who harvest retail investors through rule changes and the use of passive funds' "certain takeover"
are not value-creating investors, but wealth-transferring predators.
Index Inclusion Rule Revision = Institutionalized Retail Harvesting
When rule makers conspire with vested interests, the "passivity" of passive investing becomes the perfect harvesting tool:
Final Judgment: Between Hope and Warning
The real potential of the AI technology revolution cannot be denied, but technological revolution and capital bubble have never been synonymous.
The legacy of the internet bubble is Amazon and Google, but its cost is the wealth destruction of a generation of investors and a five-year innovation winter.
If the 2026 AI bubble bursts, its legacy may be compute infrastructure and breakthroughs in certain vertical fields,
but its cost may be systemic shocks to the global financial system and shrinking pensions for tens of millions of ordinary workers.
More dangerously, this bubble's harvesting mechanism is far more hidden and institutionalized than in 2000.
When passive index funds become tools for "certain takeover," and index rule revisions become channels for interest transfer,
the market economy's "price discovery" function has been severely distorted. This is not a failure of the free market, but a conscious manipulation of the rules.
Core Judgment Framework
Key Variables
Can Anthropic's B-end revenue sustain high growth
Can SpaceX Starlink cash flow cover xAI bleeding
Can OpenAI achieve breakeven before 2030
↓
Trigger Conditions
Whether enterprise AI adoption substantively improves
Whether bank AI credit sees large-scale bad debts
Whether passive index buying can maintain price stability
↓
Final Verdict
🟢 Cornerstone of the Century: AI Productivity Truly Delivers
🔴 Greatest Bubble: Compute Illusion Bursts
History does not simply repeat, but it rhymes. The 2000 internet bubble taught us: the technological revolution will eventually deliver,
but the vast majority of participants in the bubble will become fuel rather than passengers. If the 2026 AI bubble follows the same script,
the cruelest difference is that this time, retail investors don't even have the right to choose not to participate,
their pensions have already been tied to this gamble by the index-rule revisers.
For professional investors and regulators, while chasing trillion-dollar tech myths,
they must maintain the highest level of vigilance against the predatory nature of the passive-takeover mechanism, the financial black hole of massive compute depreciation, and the systemic risks of bank credit.
Technology is worth believing in, but the greed of capitalists is always worth doubting.
Primary Data Sources:
Company Financial Data: SpaceX S-1 Filing (SEC EDGAR, May 20, 2026), Morningstar, NDTV Profit, Securities Times, PitchBook
Valuation & IPO Info: Bloomberg (Apr-May 2026), Reuters, CNBC, TechStackIPO.com, The Information, TechJournal.org
Anthropic Data: Anthropic Official Announcement (May 28, 2026), 36Kr (Jun 2, 2026), Toutiao, Shepherd Gazette
OpenAI Data: The AI Journal (May 2026), RoboRhythms (May 22, 2026), The Planet Tools, AI2.work
IPO Market Data: KPMG "Mainland China and Hong Kong IPO Market Q1 2026 Review" (Apr 2026), IPOX SchusterWatch Q1 2026, Dealogic ECM Highlights 1Q26, EY-Parthenon
AI Investment & Productivity: MIT NANDA "The GenAI Divide: State of AI in Business 2025" (Jul 2025), NBER Working Paper 34836 (Feb 2026), Goldman Sachs Research (Mar 2026), Futurum Group (Feb 2026), Sequoia Capital Analysis
Index Rule Revisions: Nasdaq Official Announcement (Mar 30, 2026), Ashurst Legal Analysis (Apr 16, 2026), Bloomberg Linea, Xueqiu, LongPort, StockWireX
Market Analysis: BofA Michael Hartnett, Morgan Stanley Counterpoint Global, JPMorgan Research, HSBC Analyst Reports, S&P Global Research
Report Date: June 2026 | Version: v2.1 (Data Verification Edition)